
The Dodgers lost a major league-record 2,418 man days to the disabled list in 2016. (via Keith Allison)
It’s that time of year when I get around to slogging through the past season’s disabled list data and investigate trends. The big change this season is that I don’t have any bonus coverage. After examining injury information for seven seasons, I have hit a road block with new topics. Instead of rehashing studies already done, I am going to suggest some ways injury analysis can expand.
2016
To put in simply, 2016 was the season to break all disabled list highs. Here are the major league totals for days missed and DL trips.


The new high for DL trips (571) broke the old record by 17. The number is a three percent increase over the previous high in 2013.
The real eye-opener is with the days lost. The total (36893) broke the previous high by over 6,000 days (21% increase). This total averages out to 200 extra days per team. In 2016, the days lost per trip got over 60 for the first time ever (average of 2002 to 2015 was 54.7).

As you can see the average days lost per trip hovered around the 55-day mark until this season. The jump may be attributed to Tommy John surgeries taking 14 months for a pitcher to return versus the historic 12 months. Otherwise, nothing yet sticks out as being abnormal.
Now onto the individual team totals. First, here are the one, three, five, and 15-year averages for each team.


While the White Sox still dominate the 15-year total, three different teams lead the one (Astros), three (Indians) and five (Twins) year time frames.
The most interesting piece of information is that the Dodgers, Athletics and Braves each broke the all-time single-season high in days missed, a record previously held by the 2014 Rangers. The Dodgers didn’t mess around and set the all-time high with over 2,400 days lost.
| Team | Season | Days Lost |
|---|---|---|
| Dodgers | 2016 | 2418 |
| Athletics | 2016 | 2308 |
| Braves | 2016 | 2205 |
| Rangers | 2014 | 2116 |
| Diamondbacks | 2004 | 2017 |
| Padres | 2012 | 1973 |
| Royals | 2007 | 1857 |
| Rangers | 2015 | 1846 |
| Rangers | 2004 | 1811 |
| Mets | 2015 | 1790 |
The Dodgers also tied the 2012 Red Sox with 33 DL trips. The 2016 Braves and Athletics also make the top 10.
| Team | Season | DL Trips |
|---|---|---|
| Dodgers | 2016 | 33 |
| Red Sox | 2012 | 33 |
| Twins | 2011 | 31 |
| Braves | 2016 | 30 |
| Rangers | 2004 | 30 |
| Nationals | 2008 | 30 |
| Red Sox | 2010 | 30 |
| Yankees | 2013 | 29 |
| Padres | 2002 | 28 |
| Athletics | 2016 | 27 |
Now, one more all-time high set by the Dodgers. Here are the DL days and trips by team divided up by pitchers and hitters.
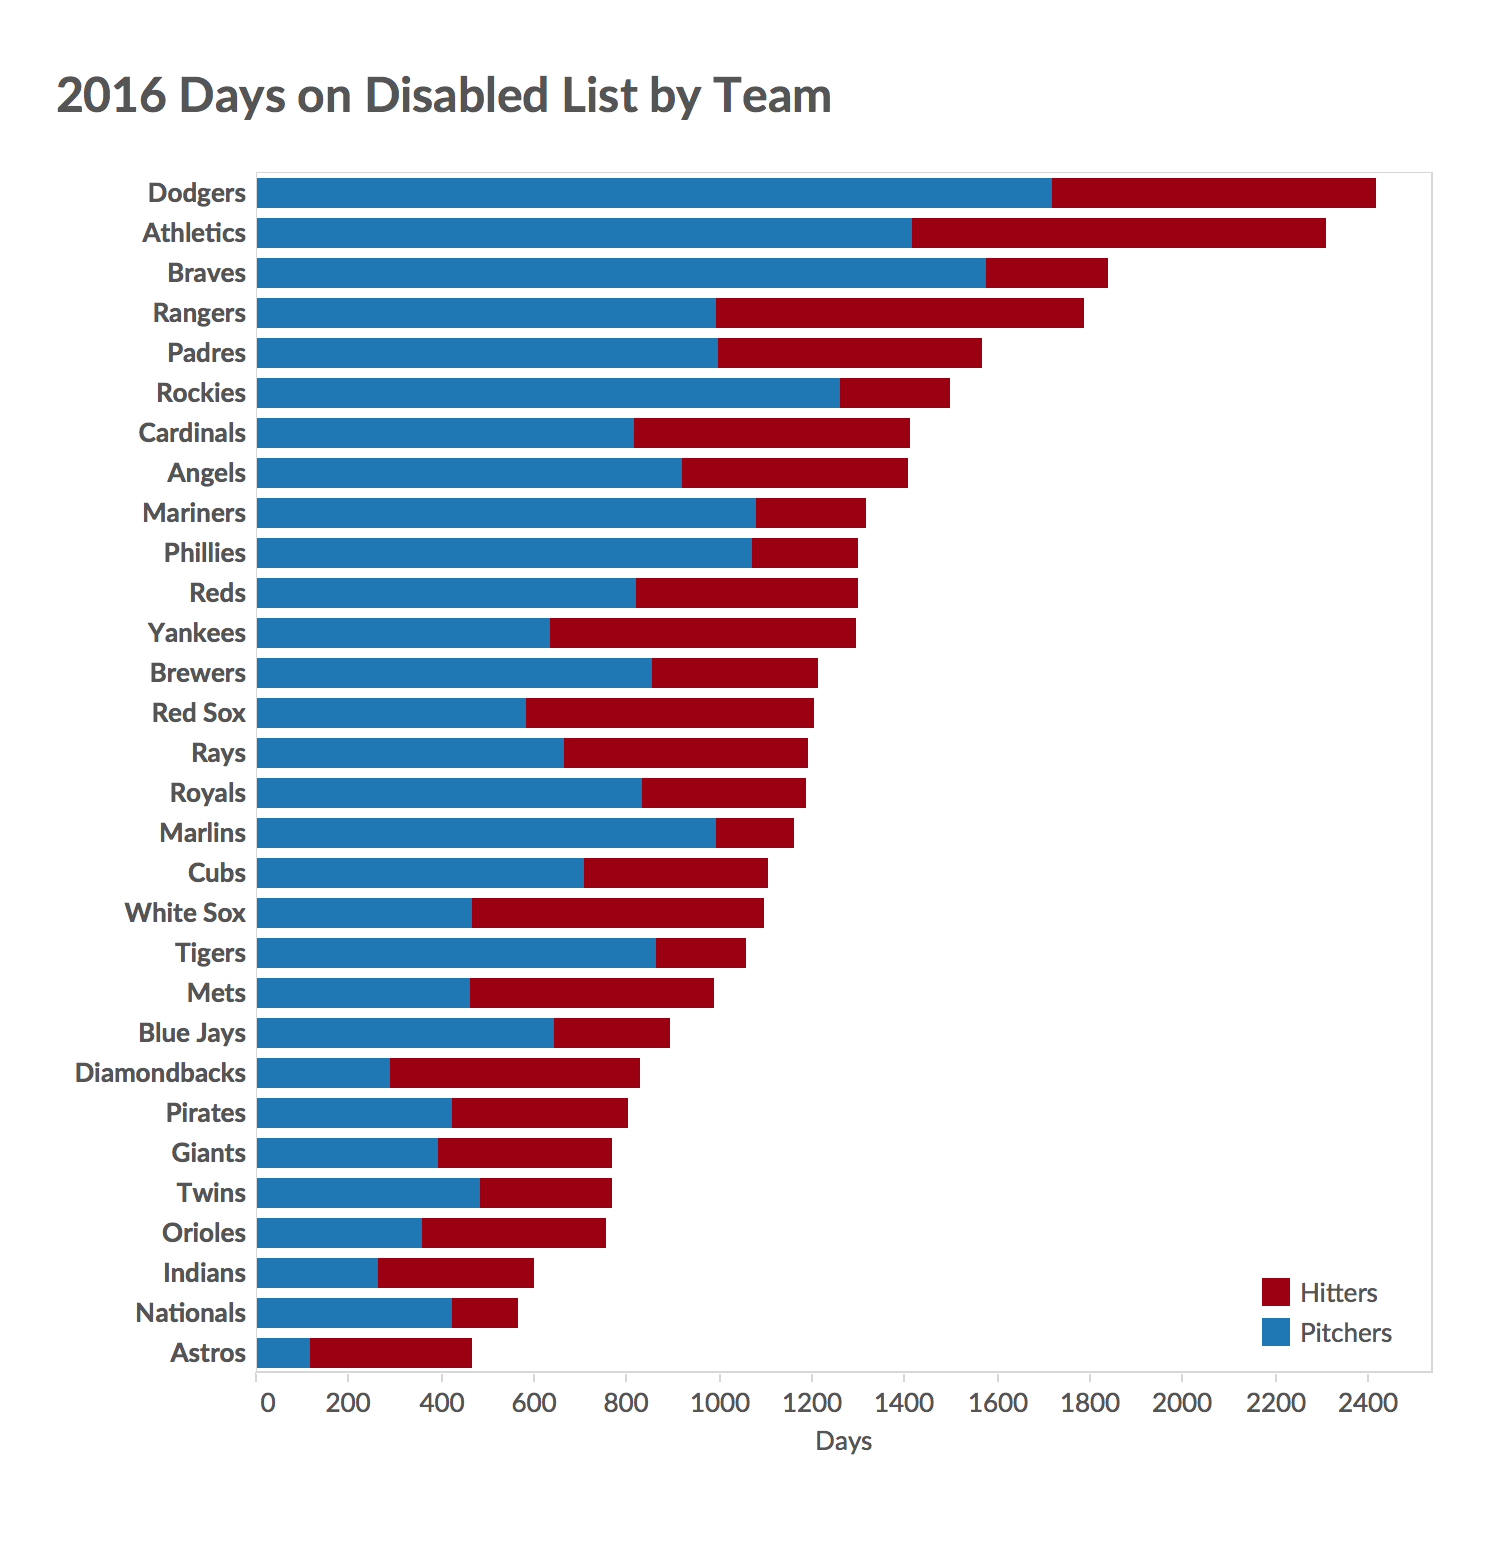

Here are the all-times from the two graphs:
- Pitchers (total days): Dodgers (1st), Braves (2nd), Athletics (3rd), Rockies (9th)
- Hitters (total days): Athletics (5th)
- Pitchers (total trips): Dodgers (1st), Braves (3rd), Rockies (6th), Athletics (6th)
- Hitters (total trips): none
This season, it was the pitchers who missed the most days by far. Here is a comparison of 2016 days missed by pitchers to the overall total a few seasons back.
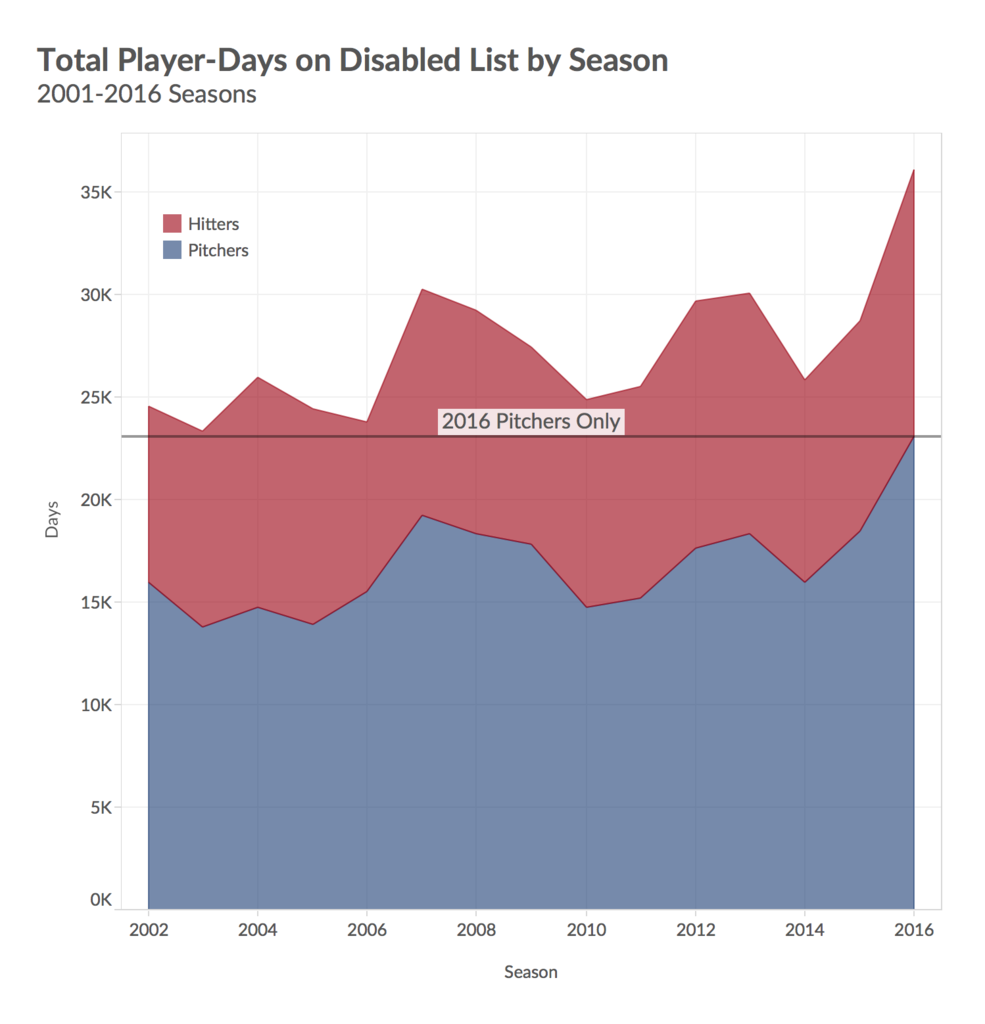
The number of total days lost to the DL in 2006 was 23,833. The days lost only to pitchers this past year was 23,121. If the pitcher-related increase in DL days continues, at some point in the near future, more days will be lost to just pitchers than to the combined total of hitters and pitchers.
Finally, here is a customizable table showing the number of total days per team lost to the DL over time (thanks to Bill Petti for updating the information).
Now that the new yearly data have been examined, here are some ways injury information can be expanded to help with future research.
1. More and better information
The biggest issue with the injury information is the lack of it. When I started examining this stuff years back, I was amazed there was none. Even though everything was clearly available on MLB.com’s website, not one person was tracking and processing it. Baseball stats are available going back to before 1900, but current injury information might as well have been nonexistent.
I was first able to have a working injury database when FanGraphs paid me to create one from 2002 to 2009. Since 2010, I have volunteered my time every year to go through the MLB’s suspect transaction data. With this information, I have been able to get the preceding information, but the disabled list is a limited resource and mainly is used as a roster management tool.
The first area in which more information could be obtained is collecting older disabled list information. The information dating back to 2001 is available at MLB.com and even more information going back to 1964 is available at Pro Sports Transactions. More information, if used correctly, will lead to richer information. There is no simple way to scrape the data. I tried. The biggest issue is matching up the days on which a player enters and leaves the DL, especially the further back a person goes. Some of the transactions are missing or doubled up or the wording is inconsistent. The data are a mess and it takes time to comb through by hand. From experience, it takes about three to four watching-paint-dry boring hours to complete. If a few brave souls sacrificed one evening, this project could be done quickly, but since it hasn’t been done in 15 years, I expect it never will.
Another area in which the dataset can be expanded is more detailed information. This past year, three instances existed where an injury was listed just as a back injury while, on the other hand, Kevan Smith had sacroiliac joint dysfunction (i.e. a back injury). The first bit of information is completely useless and the second gives a detailed account of the information. Most of the time the information is stated as a side then a location then an injury such as “left forearm strain.” The information on the extent and how the forearm was strained is missing. The extent (grade) of the strain isn’t stated in the transaction, but the data may be available from media reports.
The increase in details could help to get a better picture of an injury once it happens to another player.
On the same front, it would be interesting to have a repository of initially stated return times to get an idea of how much teams oversell or undersell the extent of an injury.
I feel I’m where researchers were with Pitchf/x a couple of seasons back. While the information we were receiving was still useful, it had been extensively studied. Better batted ball information was available and teams were using it but researchers in the general public were left in the cold until StatCast began releasing data two seasons ago. With MLB’s new injury database, people will now be left to speculate on how the information is being used. I understand the players don’t want their detailed medical information to go public, but the data can be censored while still allowing increased understanding of information like return times and various trends. I expect some of the final information to eventually get into the public’s hands, but the process will likely be slow and limited.
This is by far the most important obstacle to understanding how injuries affect the game. I am sure there are a few ideas I’ve missed and will touch on but not much more is to be learned with available data.
2. Trends vs. noise
With the amount of disabled list-related injury data currently created, we are finally getting to the point where we can begin to find out if a change is noise or a yearly trend. The past season, Tommy John surgeries were way down from the previous season. Instead of guessing if this drop is from normal variation or systematic change, we can now look back to see how often these drops occur. With basic statistics, we can look back over 100 years to find various changes. Right now, we are just getting into that frontier with injuries analysis.
3. Predictive vs. Reactive
The real unexplored frontier in injury analysis starts with getting away from reactive injury analysis and becoming more predictive with it. A big step forward happened this season with the addition of spin rate to the public Statcast data. We were able to notice changes in velocity and spin for pitchers and see which ones were changing. This type of analysis help to pinpoint Wade Davis’ changing fastball and the eventual DL trip.
Additionally, we can start to determine if a hitter isn’t hitting with as much power and therefore an injury may be nagging him. The work is just starting in this frontier and the results are a little slow in coming. It will probably take a few seasons to finish optimizing and back checking but having an idea if a slump is a from bad luck or a drop is production is the next step in our understanding of the game.
4. The New 10-Day Disabled List
Finally, the new minimum disabled list time frame of 10 days will mark a definite point in change for data collecting. When I examine the 2017 data next year, I expect there to be all-time highs in days missed and trips to the DL, led by pitchers. The 10-day DL is a perfect vehicle to bring up an extra bullpen pitcher whenever a starting pitcher will miss a start. With the team having no plans to use the fifth starter anyway, he can go on the DL and then come back to make his next start. Even with all-time high numbers posted this past year for time lost and some regression expected, I expect all the all-time highs to fall by the end of next season.
Conclusion
While I feel injury analysis just began, I also feel I have already hit a roadblock without any possible new and better information. I am not going to hold my breath on anything coming out anytime soon. Please let me know if you have ideas for future analysis. I will dabble in a study here and there but don’t expect any major breakthroughs without the amount of available data increasing.